Load Testing With Jmeter On Kubernetes and OpenShift

Update March 17 / 2019: Jmeter Operator is released:
https://github.com/kubernauts/jmeter-operator
In one of my recent projects we’d to perform load testing with Apache Jmeter on Kubernetes for some large scale web applications which are running on Kubernetes.
This articles shares our experience and gives you an overview of how to implement load testing with Apache Jmeter running on a Kubernetes cluster and was presented by our meetup, the recording is available on our YouTube Channel here:
Pre-requisite
This article assumes that you already have a kubernetes cluster > Kubernetes 1.8 or OpenShift version > 3.5 running on either baremetal, virtual machine or on any other cloud provider.
Introduction
Load testing is the process of putting demand on a software system or computing device and measuring its response. Load testing is performed to determine a system’s behavior under both normal and anticipated peak load conditions. It helps to identify the maximum operating capacity of an application as well as any bottlenecks and determine which element is causing degradation. When the load placed on the system is raised beyond normal usage patterns to test the system’s response at unusually high or peak loads, it is known as stress testing. The load is usually so great that error conditions are the expected result, but there is no clear boundary when an activity ceases to be a load test and becomes a stress test (from wikipedia definition).
Apache Jmeter is the most widely used open source load testing framework, it is written in java hence it requires that you have a java runtime software installed. The project is matured having several contributions and plugins that have been developed for it.
It can virtually test all kinds of application.
Distributed Load Testing Scenario
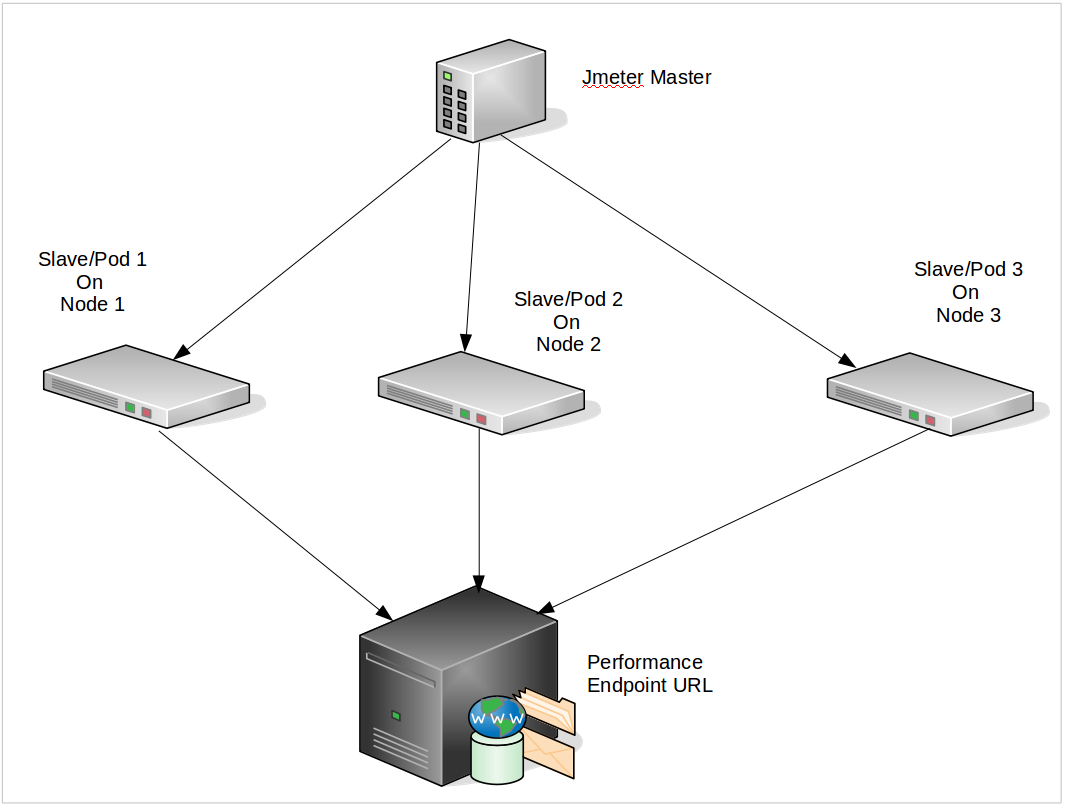
The above shows the concept of distributed load testing whereby you initiate your test from a central node (called the Jmeter master) which in turn sends the test script to the slaves, the slaves are the nodes/pods that carries out the load testing. You will use a distributed architecture like this if you want to carry out an intensive load test which can simulate hundreds and thousands of simultaneous users, this is the scenario we will be looking at in this blog post.
Kubernetes Deployment

Using the figure above, we will be using Inluxdb to store the results of the load testing and then use Grafana to see the trend as the test continues and also historical data.
We have created some scripts that can be used to achieve this purpose, the Github repo is provided below:
https://github.com/kubernauts/jmeter-kubernetes
Below is the description of each component in the repo:
- jmeter_cluster_create.sh — This script will ask for a unique tenant name (namespace) and then it will go ahead to create the namespace and all the components (jmeter master, slaves, influxdb and grafana).
- N.B — Set the number of replicas you want to use for the slaves in the jmeter_slaves_deploy.yaml file before starting, normally the replicas should match the number of worker nodes that you have.
- jmeter_master_configmap.yaml — The config map for the Jmeter master deployment
- jmeter_master_deployment.yaml — The deployment manifest for the jmeter master.
- jmeter_slaves_deploy.yaml — The deployment manifest for the jmeter slaves.
- jmeter_slave_svc.yaml — The service manifest for the jmeter slave. It uses an headless service, this enables us to get just the jmeter slaves POD ip address directly, we don’t need the DNS or round robin for this. We created this so as to make easier to feed the slave pod IP addresses directly to the jmeter master, the advantage of this will be shown later.
- jmeter_influxdb_configmap.yaml — The config map for the influxdb deployment. This configures the influxdb to exposes port 2003 so as to support the graphite if you want to use the graphite storage method in addition to the default influxdb port. So you can use the influxdb deployment to support both the jmeter backend listener methods (graphite and influxdb).
- jmeter_influxdb_deploy.yaml — The deployment manifest for Influxdb
- jmeter_influxdb_svc.yaml — The service manifest for the Influxdb.
- jmeter_grafana_deploy.yaml — The grafana deployment manifest.
- jmeter_grafana_svc.yaml — The service manifest for the grafana deployment, it uses NodePort by default, you can change this to LoadBalancer if you are running this in a public cloud (and maybe setup a CNAME to shorten the name with a FQDN).
- jmeter_grafana_reporter.yaml — The deployment and service manifest of the reporter module.
- dashboard.sh — This script is used to create the following automatically: (1) An influxdb database (jmeter) in the influxdb pod. (2) A datasource (jmeterdb) in the grafana pod
- start_test.sh — This script is used to run the Jmeter test script automatically without you manually logging into the Jmeter master shell, it will ask for the location of the jmeter test script, then it will copy it to the jmeter master pod and initiate the test automatically towards the jmeter slaves.
- GrafanaJMeterTemplate.json — A prebuilt jmeter grafana dashboard, this can also be found in the jmeter installation folder (extras folder).
Deployment Steps
Clone github repo
git clone https://github.com/kubernauts/jmeter-kubernetes
Cloning into 'jmeter-kubernetes'...
remote: Counting objects: 18, done.
remote: Compressing objects: 100% (16/16), done.
remote: Total 18 (delta 0), reused 18 (delta 0), pack-reused 0
Unpacking objects: 100% (18/18), done.
Checking connectivity... done.
cd jmeter-kubernetes/Make the scripts executable and launch jmeter_cluster.sh to start the deployment
$ chmod +x jmeter_cluster_create.sh dashboard.sh start_test.sh
$ ./jmeter_cluster_create.sh
checking if kubectl is present
Client Version: v1.9.0+coreos.0
Server Version: v1.9.0+coreos.0
Current list of namespaces on the kubernetes cluster:
default
don
kube-public
kube-system
test
Enter the name of the new tenant unique name, this will be used to create the namespace
kubernauts
Creating Namespace: kubernauts
namespace "kubernauts" created
Namspace kubernauts has been created
Creating Jmeter slave nodes
Number of worker nodes on this cluster is 2
deployment "jmeter-slaves" created
service "jmeter-slaves-svc" created
Creating Jmeter Master
configmap "jmeter-load-test" created
deployment "jmeter-master" created
Creating Influxdb and the service
configmap "influxdb-config" created
deployment "influxdb-jmeter" created
service "jmeter-influxdb" created
Creating Grafana Deployment
deployment "jmeter-grafana" created
service "jmeter-grafana" created
Printout Of the kubernauts Objects
NAME DESIRED CURRENT UP-TO-DATE AVAILABLE AGE
deploy/influxdb-jmeter 1 1 1 0 2s
deploy/jmeter-grafana 1 1 1 0 1s
deploy/jmeter-master 1 1 1 0 3s
deploy/jmeter-slaves 2 2 2 1 4s
NAME DESIRED CURRENT READY AGE
rs/influxdb-jmeter-5cbd7b8469 1 1 0 2s
rs/jmeter-grafana-65dd5f6b79 1 1 0 1s
rs/jmeter-master-75f66dbb5f 1 1 0 3s
rs/jmeter-slaves-57cc6b9cfc 2 2 1 4s
NAME READY STATUS RESTARTS AGE
po/influxdb-jmeter-5cbd7b8469-mbvtg 0/1 ContainerCreating 0 2s
po/jmeter-grafana-65dd5f6b79-lzjqm 0/1 ContainerCreating 0 1s
po/jmeter-master-75f66dbb5f-264bs 0/1 ContainerCreating 0 3s
po/jmeter-slaves-57cc6b9cfc-b877l 0/1 ContainerCreating 0 4s
po/jmeter-slaves-57cc6b9cfc-plssn 1/1 Running 0 4s
NAME TYPE CLUSTER-IP EXTERNAL-IP PORT(S) AGE
svc/jmeter-grafana NodePort 10.233.27.49 <none> 3000:32766/TCP 0s
svc/jmeter-influxdb ClusterIP 10.233.17.59 <none> 8083/TCP,8086/TCP,2003/TCP 1s
svc/jmeter-slaves-svc ClusterIP None <none> 1099/TCP,50000/TCP 3sN.B — Wait until all the pods are up and running before continuing
$ kubectl get -n kubernauts po
NAME                               READY     STATUS    RESTARTS   AGE
influxdb-jmeter-5cbd7b8469-mbvtg   1/1       Running   0          4m
jmeter-grafana-65dd5f6b79-lzjqm    1/1       Running   0          4m
jmeter-master-75f66dbb5f-264bs     1/1       Running   0          4m
jmeter-slaves-57cc6b9cfc-b877l     1/1       Running   0          4m
jmeter-slaves-57cc6b9cfc-plssn     1/1       Running   0          4m
Launch the dashboard script
$ ./dashboard.sh
Creating Influxdb jmeter Database
Creating the Influxdb data source
{"datasource":{"id":1,"orgId":1,"name":"jmeterdb","type":"influxdb","typeLogoUrl":"","access":"proxy","url":"http://jmeter-influxdb:8086","password":"admin","user":"admin","database":"jmeter","basicAuth":false,"basicAuthUser":"","basicAuthPassword":"","withCredentials":false,"isDefault":true,"secureJsonFields":{},"version":1,"readOnly":false},"id":1,"message":"Datasource added","name":"jmeterdb"}
Check the grafana service and Grafana dashboard
If you’re using minikube and would like to access the Grafana dashboard over the minikube ip address, you can delete the jmeter-grafana service and expose it to the ip address of your minikube VM:
$ kubectl delete svc jmeter-grafana
$ kubectl expose deployment jmeter-grafana --port=3000 --external-ip=$(minikube ip) --type=NodePort
In this case you can access the Grafana dashboard like this (you need to provide your minikube ip address instead of 192.168.99.101):
$ kubectl describe -n kubernauts svc jmeter-grafana
Name:                     jmeter-grafana
Namespace:                kubernauts
Labels:                   app=jmeter-grafana
Annotations:              <none>
Selector:                 app=jmeter-grafana
Type:                     NodePort
IP:                       10.96.88.60
External IPs:             192.168.99.101
Port:                     <unset>  3000/TCP
TargetPort:               3000/TCP
NodePort:                 <unset>  31794/TCP
Endpoints:                172.17.0.12:3000
Session Affinity:         None
External Traffic Policy:  Cluster
Events:                   <none>
Alternatively you can use the port forwarding feature of kubectl to access the Grafana dashboard via localhost (your pod ID will be different, please adapt accordingly, the kubectl bash completion will give you the right pod):
$ kubectl port-forward jmeter-grafana-669885566c-cj7vq 3001:3000You can access the Grafana dashboard via localhost now:
Load Balancer Support for Cloud Provider
If you’re deploying the whole thing on AWS, GCP or any other Cloud Provider with Load Balancer support, you only need to change the type NodePort to LoadBalancer as shown below (you can change the port as well to port 80 for instance):
$ cat jmeter_grafana_svc.yaml
apiVersion: v1
kind: Service
metadata:
  name: jmeter-grafana
  labels:
    app: jmeter-grafana
spec:
  ports:
    - port: 80
      targetPort: 3000
  selector:
    app: jmeter-grafana
  type: LoadBalancer
You can then access the Grafana Dashboard over the LoadBalancer IP or DNS name:
http://<loadbalancer-ip>/Start the load testing by executing start_test.sh script
N.B — You need to provide a jmeter test script (which is cloudssky.jmx in this case)
$ ./start_test.sh
Enter path to the jmx file cloudssky.jmx
Creating summariser <summary>
Created the tree successfully using cloudssky.jmx
Configuring remote engine: 10.233.66.65
Configuring remote engine: 10.233.87.12
Starting remote engines
Starting the test @ Mon Feb 12 10:00:14 UTC 2018 (1518429614812)
Remote engines have been started
Waiting for possible Shutdown/StopTestNow/Heapdump message on port 4445
summary + 15 in 00:02:13 = 0.1/s Avg: 2760 Min: 1315 Max: 6677 Err: 0 (0.00%) Active: 4 Started: 4 Finished: 0
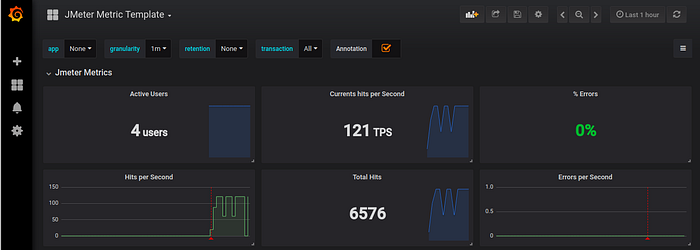
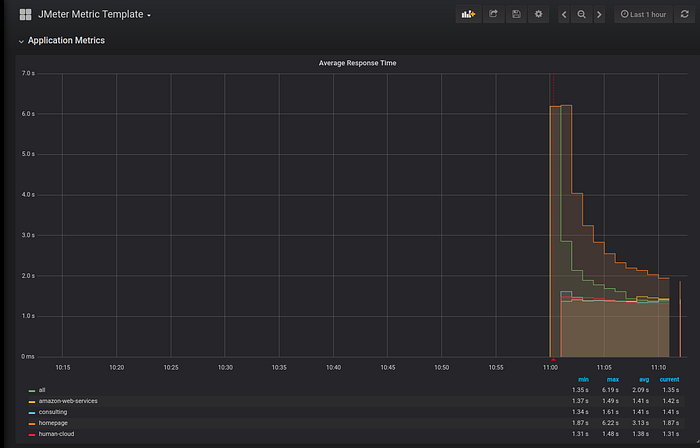
summary + 16 in 00:01:03 = 0.3/s Avg: 1506 Min: 1283 Max: 2232 Err: 0 (0.00%) Active: 4 Started: 4 Finished: 0Import the grafana dashboard template (GrafanaJMeterTemplate.json), check the status of the load test in real time

Reporting Module for Grafana
Reporting is done via a Grafana reporter module, this will be deployed in a separate deployment on the kubernetes cluster, the dockerfile for the reporter module is Dockerfile-reporter.
We assume that the name of the Grafana service name is jmeter-grafana, you can override this with the kubernetes command and argument parameters (this can be included in the deployment manifest)
Also the Grafana dashboard json file needs to be edited, we need to add the “uid” parameter (which will be set to ltaas), this uid parameter is what the reporter module will use to query the Grafana database directly:
{ “id”: 97, “uid”: “ltaas”, “title”: “JMeter Metric Template”, “tags”: [], “style”: “dark”, “timezone”: “browser”, “editable”: true, “sharedCrosshair”: true, “hideControls”: false, “time”: { “from”: “2017–06–08T01:09:30.935Z”, “to”: “2017–06–08T02:55:58.972Z” },
Note: the “uid” parameter has been already added to the GrafanaJMeterTemplate.json file!
The deployment and the service manifest is provided through the jmeter_grafana_reporter.yaml file.
To deploy the reporter module you need to run:
$ kubectl create -f jmeter_grafana_reporter.yamlThe reporter module shall be accessed from the ingress controller (since the ingress name will be constant), the full ingress name will be used to create a URL link on the jmeter Grafana dashboard.
After the reporter POD and service are running, then a URL link needs to be created on the jmeter dashboard to point to the jmeter-reporter deployment.
For instance the Reporter URL needs to be provided as a link in the Url field as shown in the screen shot below:
http://192.168.99.101:8686/api/v5/report/ltaas
Note: if you’re on minikube you need to do something like this:
$ kubectl delete svc jmeter-reporter
$ kubectl expose deployment jmeter-reporter --port=8686 --external-ip=192.168.99.101 --type=NodePort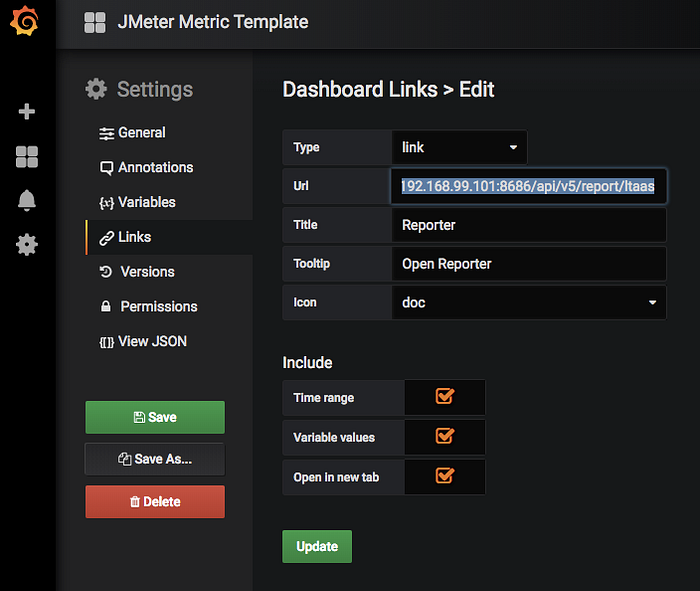
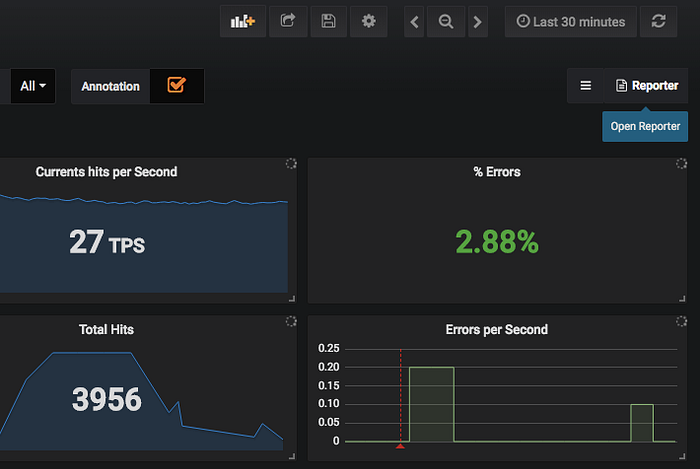
With that the reporter link will be added to upper right corner of the dashboard:
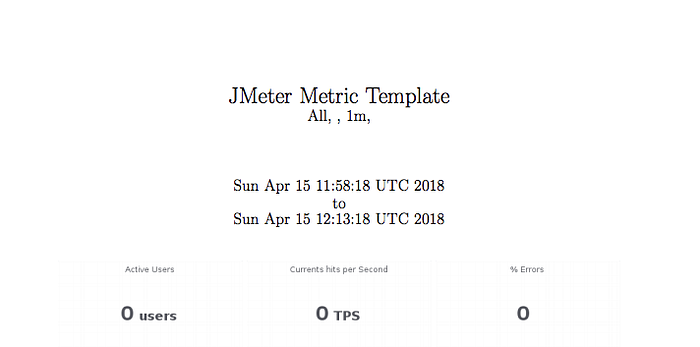
After calling the reporter link, you’ll get a PDF report similar to this:
P.S — If you want to learn about baremetal/on-prem kubernetes networking in depth using technologies like Multus, SR-IOV, Multiple network interfaces in pods etc then you can check my course on Udemy (you can use the coupon code on the course page to get a discount):
OpenShift Support
For OpenShifft support, please refer to the subfolder OpenShift.
If you‘ve any questions or would like to provide feedback, please join us on Kubernauts slack channel.
Commercial support and development is provided by Clouds Sky GmbH.